CNC OEE data collection with MTConnect
PLCGateway reads execution state, part count and conditions from MTConnect agents and calculates availability, performance and OEE for Mazak, Okuma, DMG MORI, Haas and other machine tools.
- MTConnect
mtconnect- OEE and production model
MTConnect standardises exactly the data OEE is built on: the execution state tells whether the program is active, the part counter gives the output, and conditions show faults. PLCGateway reads these data items from the agent and records them, and the production model turns them into running time, stops and produced parts.
Because the data items are standardised, the same machine definition works across brands. Machines without an agent are added with other drivers – FANUC over FOCAS, Haas over Q commands – and compared in the same OEE reports.
- Source
- MTConnect
mtconnect - Connection
- HTTP · MTConnect agent (e.g. port 5000)
- Target
- OEE and production model
- Included in
- PLCGateway SCADA
PLCGateway Embedded
Set it up in five steps
Make sure the machine's MTConnect agent is reachable (for example http://machine:5000).
Add an MTConnect device with the agent URL and, if needed, the device name.
Browse the data items and add the ones you need as tags.
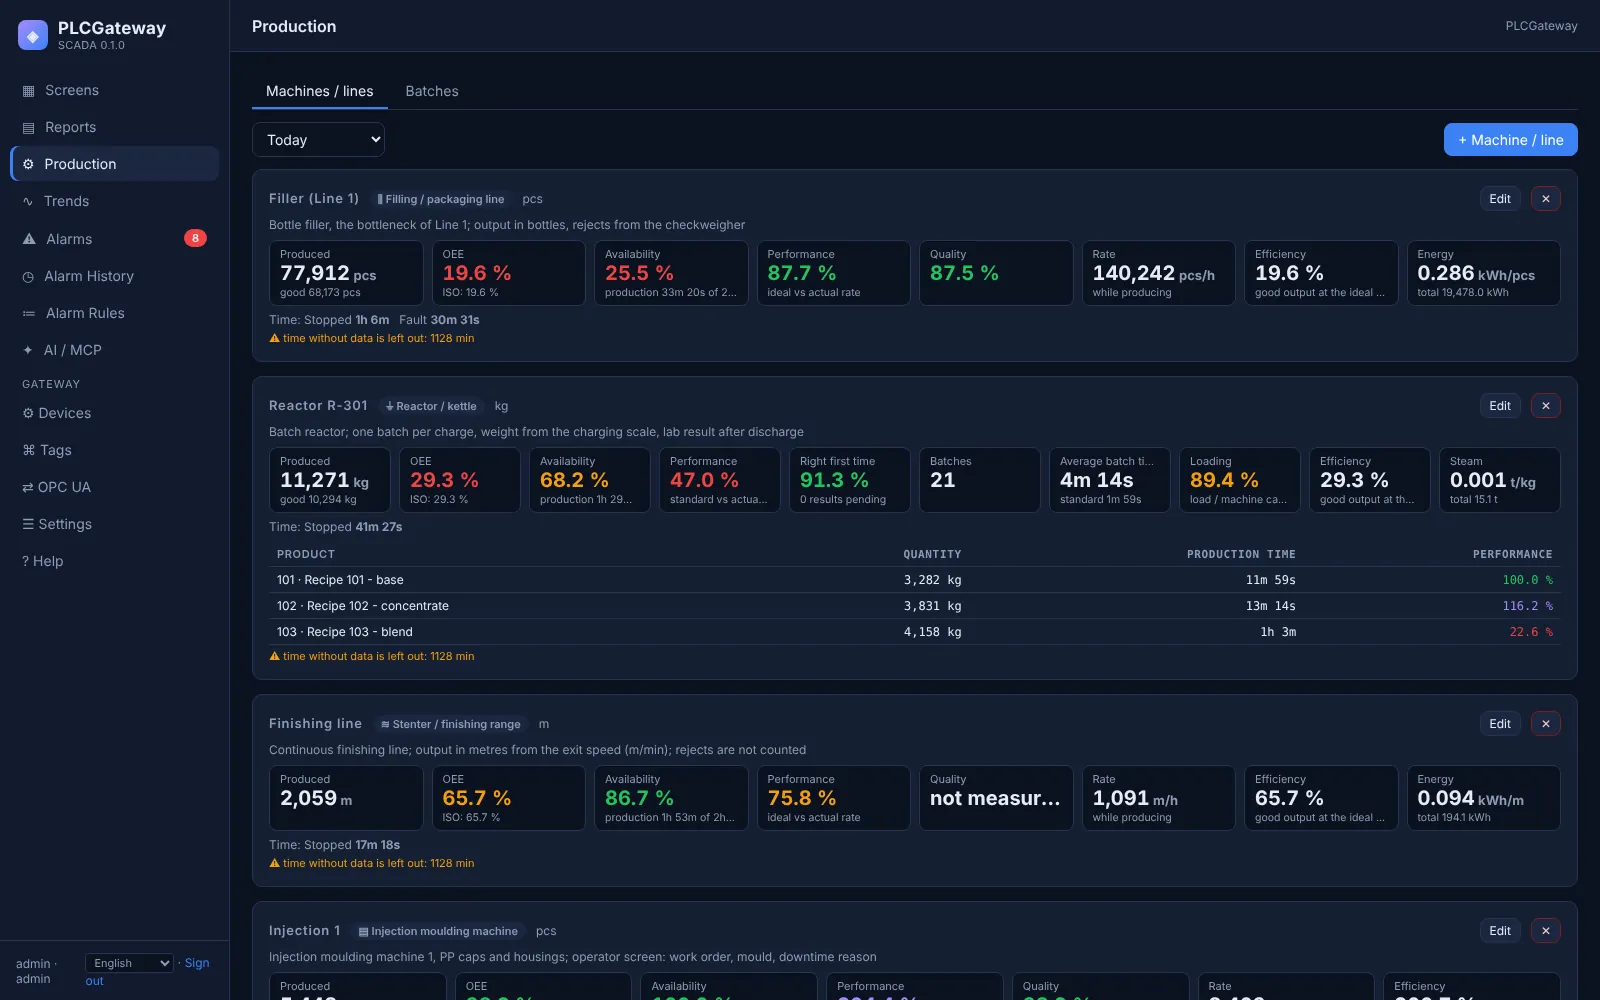
Open the Production page, add a machine of the type CNC and bind the running signal, the part counter and the ideal cycle time.
Check the preview with real data, save, and follow availability, performance, quality and OEE per shift on the Production page and in the reports.
Example: the tags behind the OEE figures
A device with the id mazak1 and tags like these are enough for availability and cycle counting. Names and values are examples.
| Tag | Address | Example value |
|---|---|---|
Availability | avail | AVAILABLE |
Execution | execution | ACTIVE |
PartCount | PartCountAct | 128 |
XPosition | Xact | 124.375 mm |
OEE from the machine's own signals
In PLCGateway SCADA each machine is defined once in the production model: the running signal, the counter that counts the parts, the ideal cycle time and, where available, good and reject counts. Availability, performance, quality and OEE are then calculated from the recorded history for any period, shift or day.
Operators choose downtime reasons on a screen, and the same figures appear on the Production page, in report dashboards and in the answers of an AI assistant connected over MCP.
- Machine editor in five steps, with a preview of the figures from real data
- Ideal cycle time per program or product, not only per machine
- Downtime reasons and planned stops from operator screens or machine signals
- Report dashboards per day, week or shift, exported as CSV, PNG or PDF
Controllers and devices
Equipment that is typically connected with this driver.
Questions and answers
Which data items are needed?
The execution state (the machine runs while it is ACTIVE), a part counter such as PartCountAct and, for the ideal cycle time, the program name. Availability and conditions help to explain stops.
Does MTConnect itself calculate OEE?
No. MTConnect only transports the data. The calculation, the downtime reasons and the reports come from PLCGateway SCADA.
What if the agent runs on a separate PC?
That works the same way: enter the agent's URL and, if it serves several machines, the device name.
Connect your machines
Tell us which controllers you run; we show you PLCGateway with your own addresses.
Product and model names are trademarks of their owners. They are named only to show which equipment the drivers communicate with; PLCGateway is not affiliated with these companies.